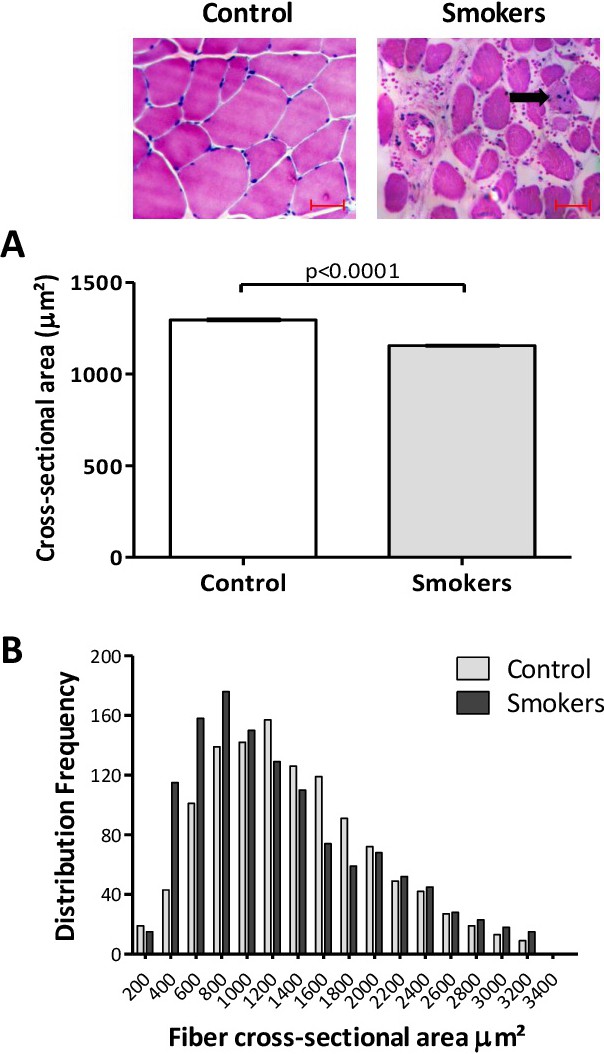
Fig. 3. Cross-sectional area. (A) Total cross-sectional area (μm²) between the groups. Data are mean ± SEM values. (B) Cumulative distribution of myofiber cross-sectional areas in smoking patients and control subjects. Representative photomicrographs are shown above (scale bars = 50 μm). Note the increased proportion of small fibers in the smoking group as well as an inflammatory infiltrate (black arrow).